Hospitality QA should not begin with test cases.It should begin with the business outcomes the technology is expected to protect.
For years, many QA teams have started downstream. Requirements are interpreted, test cases are written, scripts are executed, defects are logged, and release readiness is assessed through pass rates and defect counts. That model can work when applications are simple and failure is isolated.
A single guest-facing journey may pass through a booking engine, property management system, CRM, loyalty platform, payment gateway, revenue management engine, distribution system, mobile app, and cloud infrastructure. A defect in one layer can appear as a revenue leak, a guest complaint, a failed check-in, a mispriced room, or an operational escalation at the property level.
That is why hospitality leaders need to measure quality differently. If QA only measures how many test cases passed, it may miss the bigger question: Is the platform protecting revenue, guest trust, operational continuity, and cost efficiency?
This is the shift from traditional QA metrics to a complete hospitality quality scorecard — and it's the same measurement discipline that underpins mroads' Quality Command Center (QCC).
The Problem with Measuring QA Activity Instead of Quality
Traditional QA often measures activity: test cases executed, defects found, defects closed, pass percentage, automation scripts created. These indicators are useful, but incomplete. They tell leaders what the QA team did. They do not always tell leaders whether the business is protected.
A release can have a high test pass rate and still carry serious risk:
The booking flow may pass, but inventory synchronization may fail under real demand.
The loyalty module may work in isolation, but discount rules may conflict with promotional pricing.
The payment workflow may pass for standard transactions, but fail for refunds or partial payments.
The mobile app may function correctly, but API latency may create a poor guest experience during peak check-in windows.
Cloud autoscaling may work technically, but infrastructure cost may spike beyond acceptable thresholds.
Testing activity is not the same as business assurance. Hospitality QA must be measured against the outcomes that matter most: revenue protection, guest experience, integration health, system resilience, cloud performance, security, and implementation ROI.
Why Hospitality Needs a Multi-Dimensional QA Scorecard
Hospitality platforms are connected business ecosystems. Their quality cannot be understood through one lens. A hotel brand does not only need to know whether the application works. It needs to know whether the full operating model works:
Can guests search, book, pay, modify, and check in without friction?
Are room rates, availability, taxes, promotions, and loyalty rules accurate across channels?
Are PMS, CRM, booking, payment, and distribution systems synchronized?
Can services remain stable during seasonal peaks or flash promotions?
Is guest data protected across every system and handoff?
Is the cost of testing justified by the risk being reduced?
Is quality knowledge reusable, or does it depend on a few experienced team members?
These questions cannot be answered by defect counts alone. They require a structured scorecard — and at mroads, that scorecard isn’t a slide-deck concept. It’s the same measurement model built directly into our Quality Command Center’s Business validation, Integration view (E2E), and Domain validation tabs.
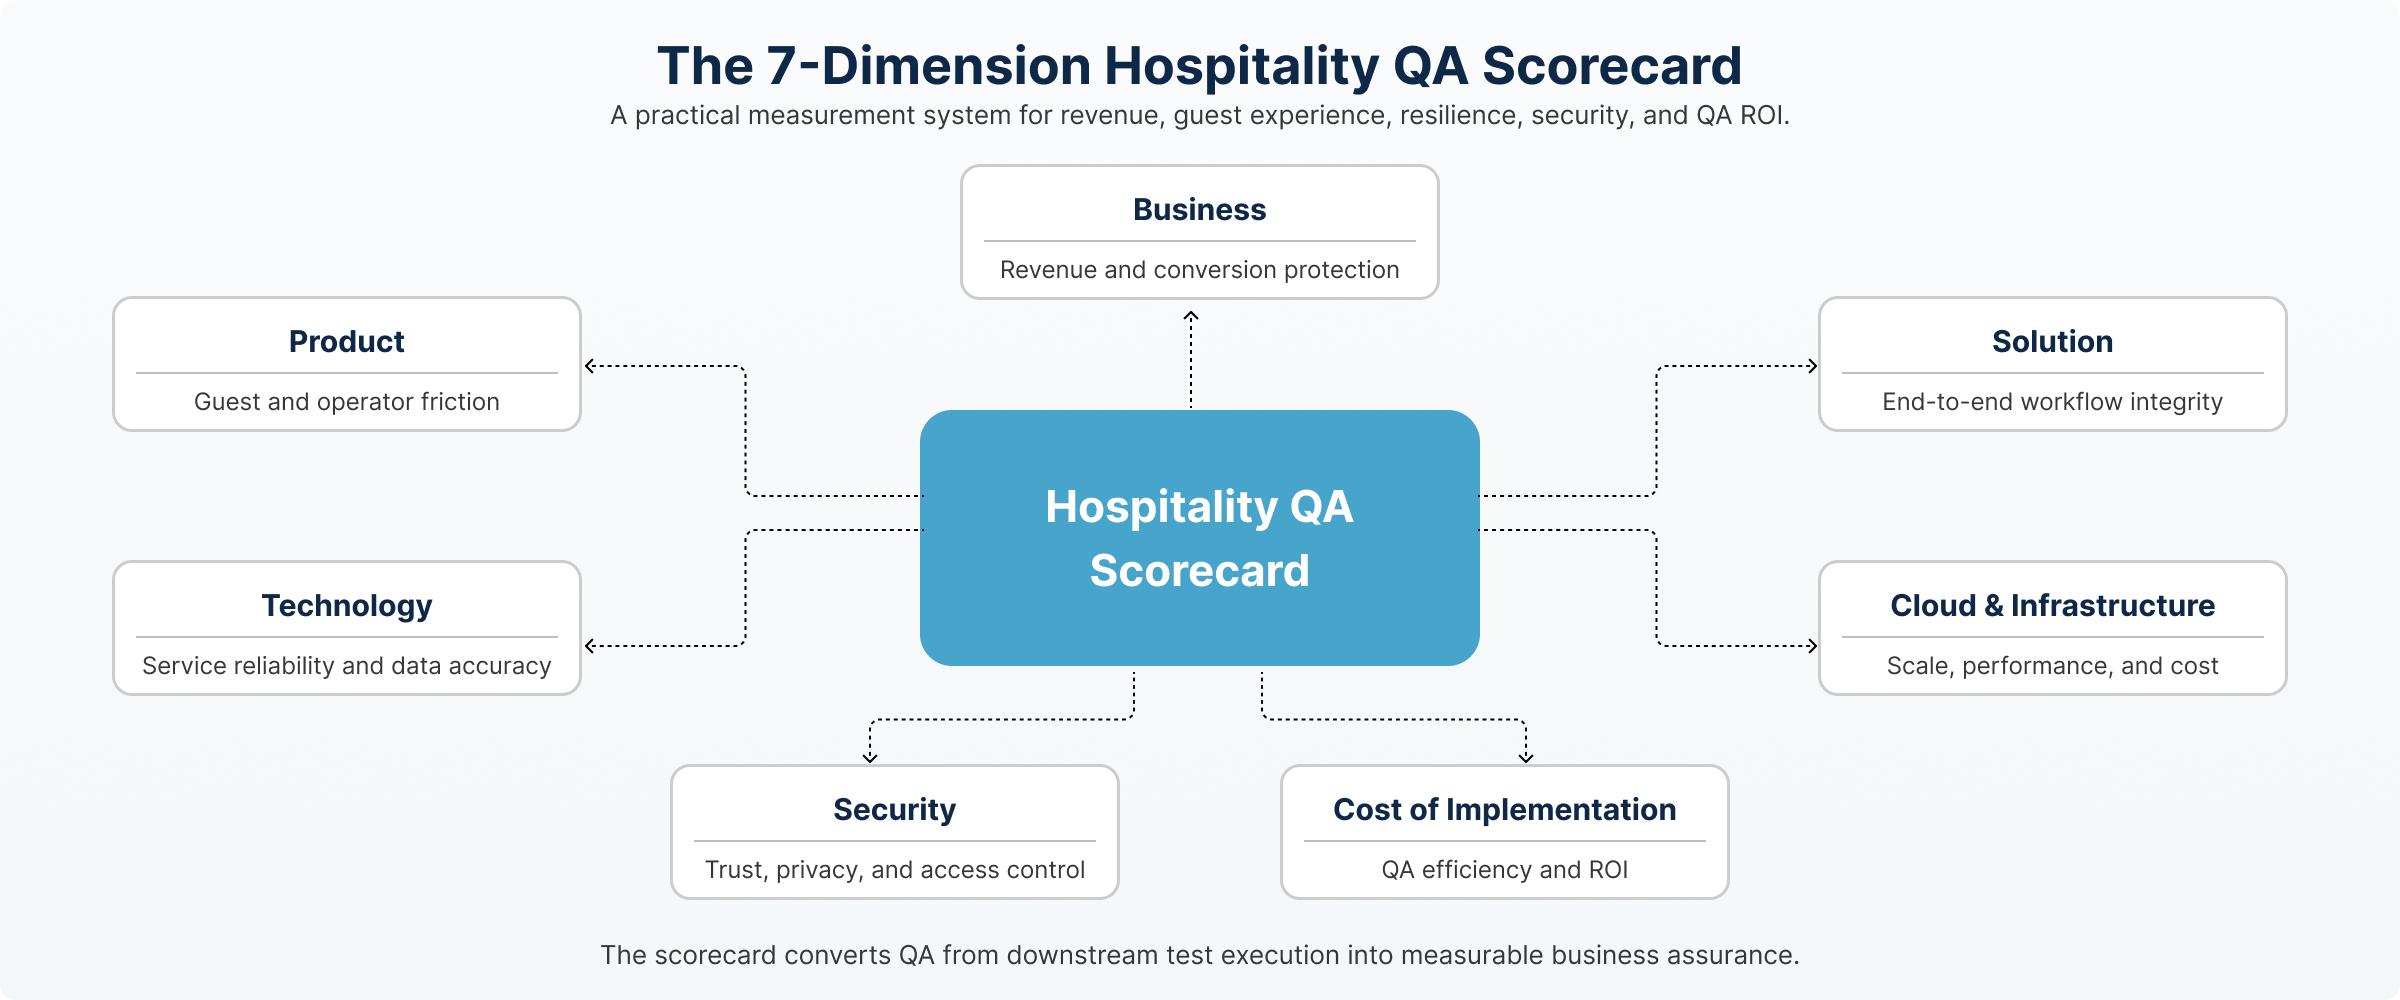
The 7 Dimensions of Hospitality QA
A better QA model begins upstream, before test code is written and before regression cycles begin. It defines the quality dimensions that matter to the business, translates those dimensions into measurable indicators, and uses them to guide test strategy, automation, release readiness, and continuous improvement.
The seven dimensions are: Business, Product, Solution, Technology, Cloud & Infrastructure, Security, and Cost of Implementation.
- Business: Protecting Revenue and Conversion
The business dimension measures whether the platform protects commercial outcomes. In hospitality, revenue is directly tied to software behavior. A broken booking funnel, incorrect room availability, failed payment, or inaccurate rate can immediately affect conversion and revenue capture.
Metric Area | Example Indicators |
|---|---|
| Booking funnel integrity | Search-to-book completion rate, abandonment points, failed booking attempts |
| Revenue-impacting defects | Defects affecting pricing, availability, payment, loyalty, or promotions |
| Offer accuracy | Correct application of discounts, packages, upsells, and loyalty benefits |
| Channel consistency | Rate and availability accuracy across direct, mobile,and distribution channels |
| Transaction reliability | Payment success rate, confirmation accuracy, refund and cancellation behavior |
Release-Readiness Signal: A release is not business ready until critical revenue workflows are validated end to end, with no unresolved defects that materially affect booking, pricing, payment, availability, or offer accuracy — the same threshold QCC’s Business validation view tracks release over release, alongside overall release readiness scoring.
- Product: Reducing Guest and Operator Friction
The product dimension measures whether the platform is usable, intuitive, and effective for guests, front-desk staff, property managers, revenue teams, and loyalty members.
Metric Area | Example Indicators |
|---|---|
| Guest journey completion | Search, booking, check-in, profile update, cancellation, service request completion |
| Friction points | Drop-offs, repeated actions, validation errors, failed form submissions |
| Operator efficiency | Time required to complete front-desk or inventory tasks |
| Mobile experience | Responsiveness, device coverage, app stability, mobile check-in success |
Release-Readiness Signal: A release is product ready when important guest and operator workflows can be completed with acceptable speed, clarity, and minimal friction. This is the dimension our UAT practice is built to protect — structured entry and exit criteria, business-owner acceptance, and requirement-to-evidence traceability above 89%, with a 20% reduction in UAT cycle time in recent engagements.
- Solution: Validating End-to-End Hospitality Workflows
The solution dimension measures whether the full ecosystem works together — one of the most important dimensions in hospitality QA, because many failures happen between systems.
Metric Area | Example Indicators |
|---|---|
| Integration success | API pass rates, message delivery, synchronization accuracy |
| Workflow continuity | End-to-end validation across booking, payment, PMS, and CRM |
| Data consistency | Matching rates, availability, guest profiles, loyalty status, and transaction records |
| Exception handling | Behavior when a service is delayed, unavailable, or returns unexpected data |
| Third-party dependency health | Stability of distribution, payment, and partner integrations |
Release-Readiness Signal: A release is solution ready when critical cross-system workflows remain synchronized under expected business conditions. This is exactly what our layered validation model and the ARA project’s Playwright-and-ReadyAPI proof of concept were built to confirm — that UI, API, and integration behavior stay coherent as one journey, not three disconnected checks.
- Technology: Ensuring Application and Service Reliability
The technology dimension measures whether the underlying architecture is reliable, accurate, maintainable, and resilient — going beyond the UI to validate service behavior, error handling, data accuracy, and failure recovery.
Metric Area | Example Indicators |
|---|---|
| API reliability | Response accuracy, error rate, timeout rate, contract compliance |
| Microservices resilience | Service availability, graceful degradation, retry behavior |
| Data accuracy | Correct processing of rates, inventory, guest data, payments, and loyalty rules |
| Defect leakage | Production defects by severity, root cause, and affected workflow |
| Test stability | Automation flakiness, false failures, environment-related failures |
Release-Readiness Signal: A release is technology ready when critical services meet defined reliability and leakage thresholds. mroads holds this dimension to a specific bar: fewer than 3% Sev1/Sev2 defects between Test and Stage, and zero Sev1/Sev2 defects between Stage and Production — governed through risk-based test design, AI-assisted test optimization, and structured RCA.
- Cloud & Infrastructure: Measuring Scale, Performance, and Cost
The cloud and infrastructure dimension measures whether the platform scales efficiently and performs reliably under real-world demand. Hospitality demand is not flat — traffic can spike during holidays, conferences, or flash promotions.
Metric Area | Example Indicators |
|---|---|
| Response time | Search, booking, payment, check-in, and profile workflow latency |
| Autoscaling behavior | Scale-out and scale-in response under load |
| Availability | Uptime and service availability for critical workflows |
| Cost efficiency | Infrastructure cost per booking, transaction, or active session |
| Observability | Monitoring coverage, alert quality, log completeness, incident traceability |
Release-Readiness Signal: A release is infrastructure ready when performance holds under expected commercial load. We validate this using approved performance tools — JMeter, k6, NeoLoad, Dynatrace, and AWS CloudWatch — and have modeled 2M+ concurrent users in recent engagements, with environment availability tracked continuously through QCC’s Environment Health panel.
- Security: Protecting Guest Trust and Enterprise Risk
The security dimension measures whether the platform protects guest data, payment flows, identity, access, and operational systems. Security must be part of QA measurement, not a separate afterthought.
Metric Area | Example Indicators |
|---|---|
| Data protection | Encryption in transit and at rest, secure storage, masking of sensitive data |
| Access control | Role-based access, privilege boundaries, unauthorized access prevention |
| Vulnerability exposure | Severity and remediation status of security findings |
| Authentication and identity | Login security, session handling, token validation, MFA workflows |
| Payment and guest data flows | Secure processing across booking, POS, payment, CRM, and loyalty systems |
Release-Readiness Signal: A release is security ready when critical data flows, access controls, and vulnerability thresholds meet defined standards. This is governed the same way we govern AI-assisted testing itself: enterprise-grade environments only, no client data used for public model training, and every action logged for audit and traceability.
- Cost of Implementation: Balancing QA Investment and Business Return
The cost of implementation dimension measures whether the assurance effort is efficient, reusable, and proportional to risk. The goal is not to test everything equally. It is to invest assurance effort where it reduces the most business risk.
Metric Area | Example Indicators |
|---|---|
| Test execution efficiency | Time required to complete regression, smoke, API, and integration suites |
| Automation ROI | Manual effort reduced, repeatability gained, release time saved |
| Defect detection efficiency | Defects found earlier in the lifecycle versus late-stage or production defects |
| Maintenance cost | Effort required to update test assets when systems change |
| Risk-adjusted coverage | Alignment of test effort with business-critical workflows |
Release-Readiness Signal: A release is economically ready when assurance effort is proportional to risk. Across our practice, this has translated into 83% of priority regression automated, 90%+ of automation suites integrated into CI/CD, 41% faster test case generation, and a standing commitment to 15% year-over-year efficiency improvement — tracked transparently rather than argued after the fact.
The 7-Dimension Hospitality QA Scorecard
Dimension | What It Measures | Hospitality Example | Release-Readiness Signal |
|---|---|---|---|
Business | Revenue and conversion impact | Booking funnel, offer redemption | No unresolved revenue-critical defects |
Product | Guest and operator experience | Mobile check-in, loyalty redemption | Friction points within acceptable threshold |
Solution | End-to-end workflow integrity | PMS, CRM, payment integration | Critical integrations synchronized |
Technology | Application and service reliability | APIs, data processing, error handling | <3% Sev1/Sev2 Test→Stage; 0% Stage→Production |
Cloud & Infrastructure | Scalability, performance, and cost | Autoscaling during peak demand | Stable response time, controlled infra cost |
Security | Trust, privacy, and access control | Guest profiles, payment data | Encryption, access, and vulnerability checks passed |
Cost of Implementation | QA efficiency and ROI | Automation coverage, execution time | Assurance effort is proportional to business risk |
This is not a parallel measurement system to the Quality Command Center — it is the business logic QCC is built to operationalize. QCC's Business validation view carries the Business and Product signals; its Integration view (E2E) carries Solution; its Domain validation and Release Quality Scorecard (Functional Quality, Automation Effectiveness, Performance Health, Defect Mgmt) carry Technology, Cloud & Infrastructure, and Security; and Cost of Implementation is tracked through the same YoY efficiency and automation ROI metrics reported against our SLA commitments.
Instead of asking How many tests passed?, leaders can ask:
- Are revenue-critical workflows protected?
- Are guests and operators experiencing less friction?
- Are integrations stable?
- Are services resilient?
- Is the cloud environment performing efficiently?
- Is guest data secure?
- Is QA effort producing measurable value?
How the Model Works Before Testing Begins
The most important part of the seven-dimension model is timing. These metrics should be defined before test execution begins. If a team waits until the end of development to decide what matters, QA becomes reactive. A systematic model starts earlier:
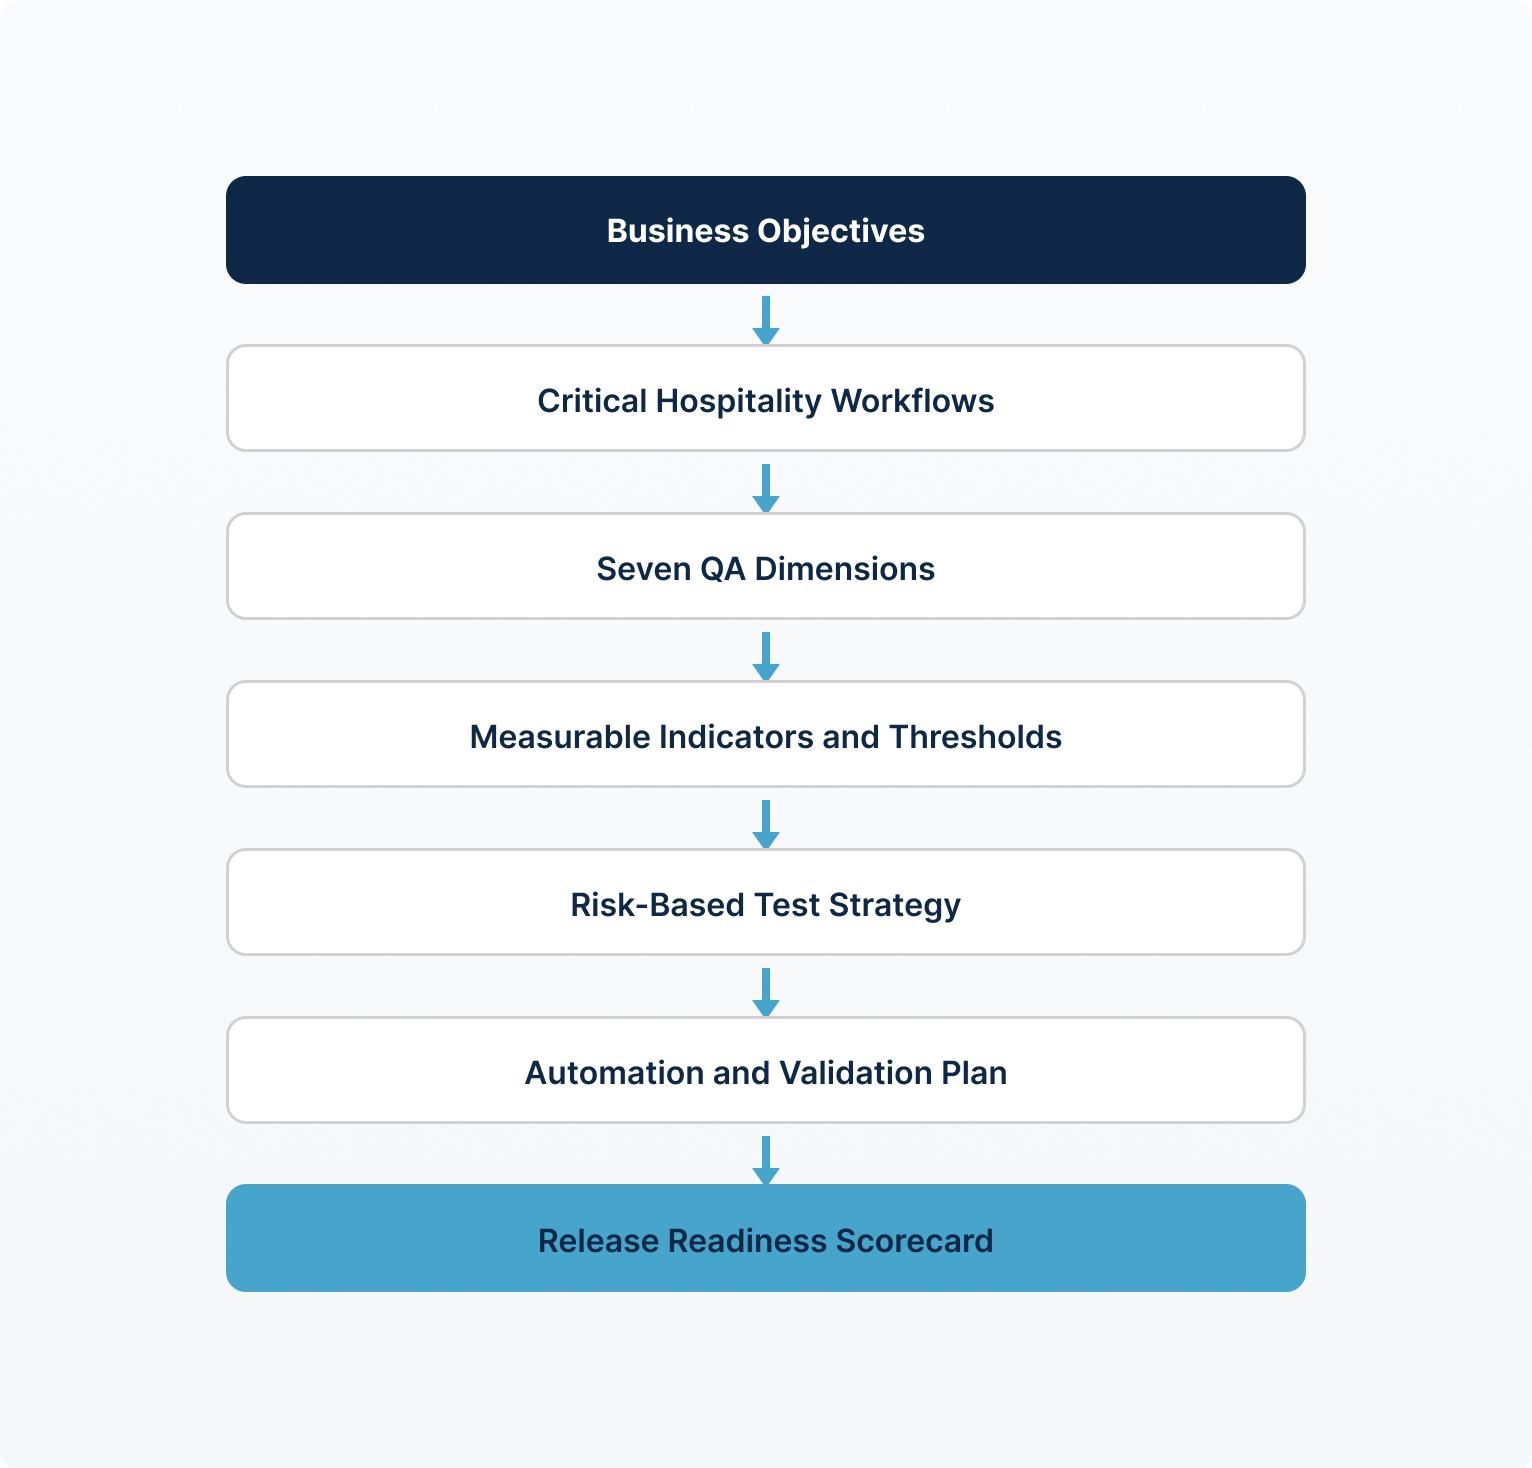
This flow ensures that testing is based on the business, product, technical, operational, and financial outcomes the platform must protect — not on guesswork
From Tribal Knowledge to a Reusable Assurance Asset
One of the hidden risks in traditional QA is dependence on tribal knowledge. Experienced testers often know which workflows are fragile, which systems are difficult to synchronize, and which releases require special attention. That knowledge is valuable, but it is also vulnerable — when a senior tester leaves or changes projects, the reasoning behind test coverage can disappear with them.
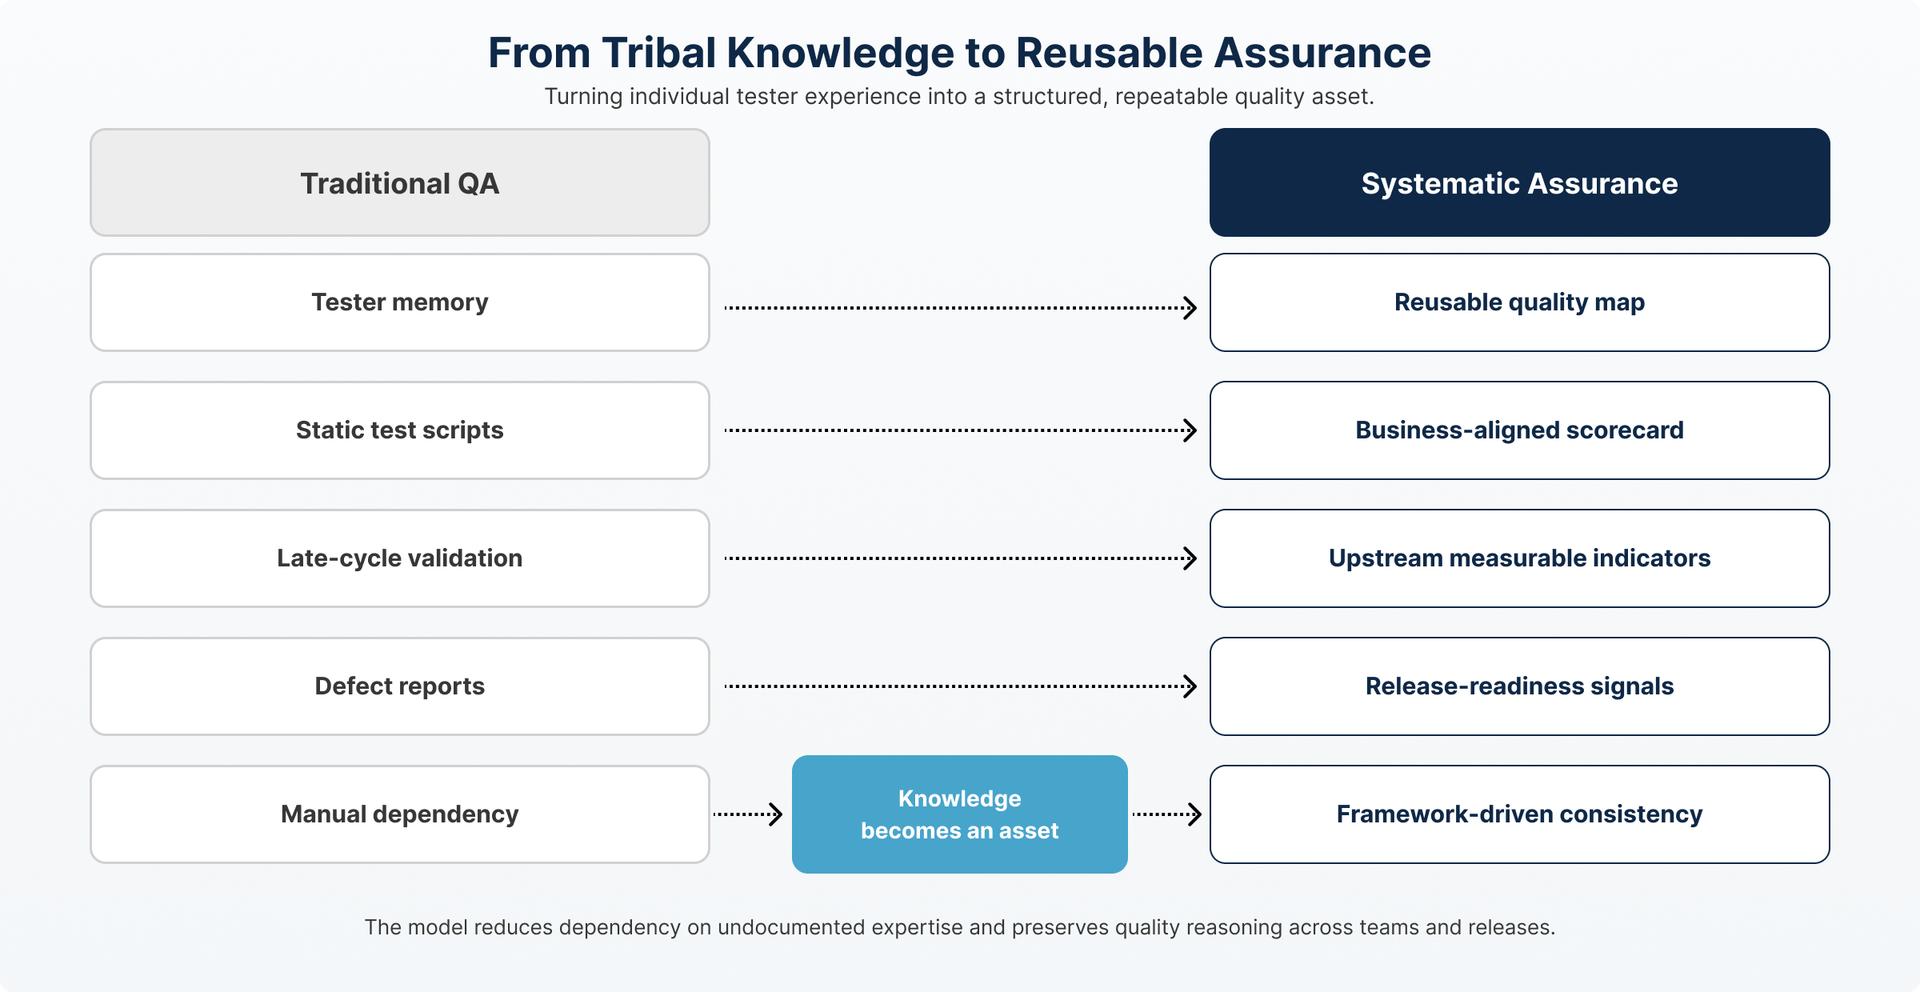
A seven-dimension scorecard helps convert individual experience into a reusable corporate asset — the same principle behind our accelerator repository, where reusable frameworks, defect patterns, and regression logic are captured and standardized rather than held in any one person's head.
What Hospitality Leaders Gain
A release should not move forward simply because the defect count is low. It should move forward because the most important business workflows are validated and the remaining risk is understood.
The seven-dimension model helps teams identify where automation will reduce the most risk and create the most repeatable value.
The model reduces reliance on undocumented tester knowledge by turning quality reasoning into structured measurement.
Executives get a scorecard that connects software quality to revenue, guest experience, operational reliability, security, and cost, rather than raw QA activity.
The scorecard becomes a feedback system, feeding the same 15% YoY efficiency commitment and continuous-improvement governance that anchors the rest of our delivery model.
The mroads Perspective
mroads approaches hospitality quality engineering through measurable assurance, not isolated test execution. Our model begins by understanding the business workflows that matter most: booking, pricing, loyalty, inventory, payment, and mobile check-in. From there, we define measurable indicators across the seven dimensions and use them to guide test strategy, automation, integration validation, performance assurance, security checks, and release readiness — all visible in one place through the Quality Command Center.
The result is a more objective QA model. One that does not depend solely on manual scripts, individual memory, or late-cycle defect discovery. Instead, it creates a reusable quality framework that helps hospitality technology leaders understand how software is performing against the outcomes that actually affect the business: time, cost, infrastructure, revenue, security, and end-user experience.
Conclusion
Hospitality QA cannot be measured only by test execution volume. The real measure of quality is whether the platform protects the business.
- Does it preserve booking revenue?
- Does it reduce guest and operator friction?
Does it keep PMS, POS, CRM, loyalty, payment, and distribution systems synchronized?
- Does it scale under demand?
- Does it protect guest data?
- Does it provide confidence without excessive cost?
These are the questions hospitality leaders should ask before a release. The seven-dimension hospitality QA scorecard gives teams a structured way to answer them — and at mroads, it isn’t a separate concept from how we deliver. It’s the same logic built into the Quality Command Center, the Agentic Framework’s governance layer, and the layered validation model that ties test execution to business outcomes.
It moves QA from downstream guesswork to upstream assurance. It replaces tribal knowledge with reusable intelligence. And it helps leaders measure what truly matters: the ability of hospitality technology to perform reliably where business outcomes, guest trust, and operational efficiency meet.

Quality Engineering Team